 Beaudry Mikhail
- Contribution
- Product / design / engineering
- Organization
- SF Mayor’s Office of Innovation
- Status
- Completed pilot
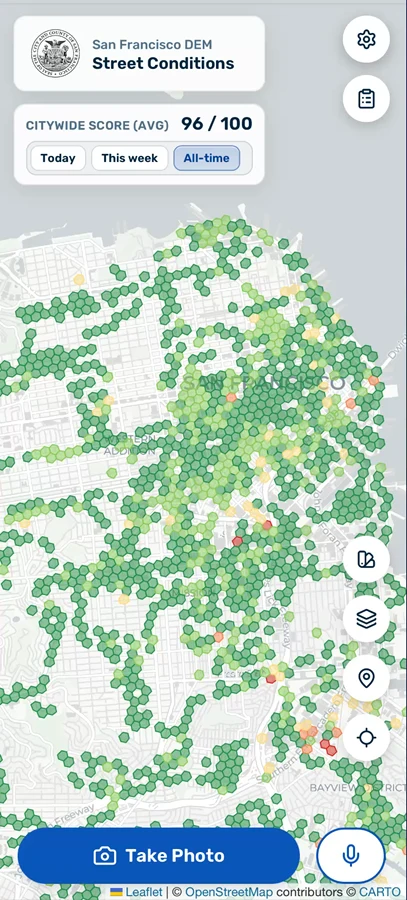
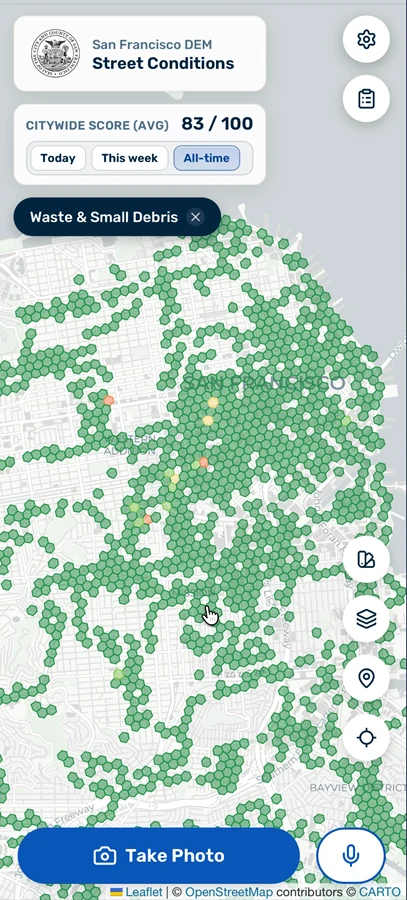
Improving street conditions was a critical priority of the Mayoral Administration. The City has historically relied heavily on 311 as a signal for where resources should be invested. While 311 effectively communicates where people request services, it does not record every condition people encounter, or reliably distinguish a place with no problems from a place where nobody reported them. It is also subject to demographic, economic, and other biases that make it a noisy signal for actual baseline conditions on the street - and baseline conditions are essential: if the City doesn't know where the real problems are, or what the impacts of interventions are, this can lead to wasted and ineffective deployments of scarce resources.
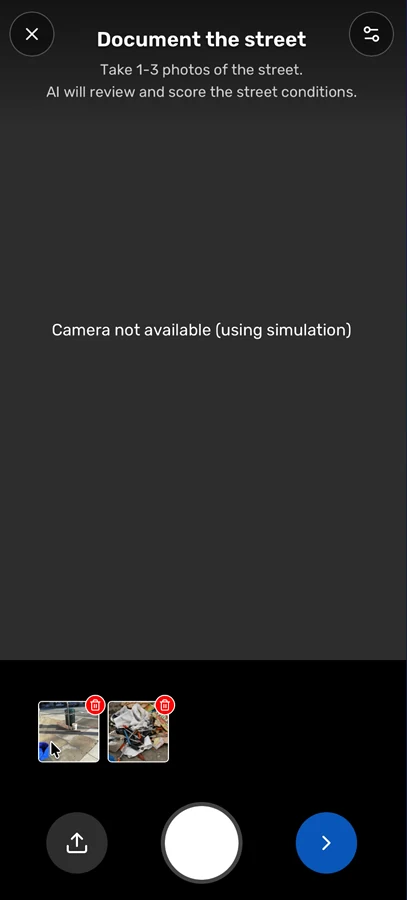
I built Street Conditions to explore a complementary approach that could establish a more definitive baseline. It was inspired by environmental data collection approaches that use distributed mobile sampling coupled with longitudinal and spatial data aggregation approaches to build definitive ambient measures of a given metric. In my case, I asked frontline staff to use an app to photograph what they saw on the street during their work - including when nothing was wrong - and used AI-assisted analysis to score observations consistently against a rubric.
I deployed the Street Conditions app over a multi-month pilot with volunteer users from the Department of Emergency Management, the Police Department, and the Fire Department.
Agentic coding as critical enabler - with critical limitations
Sometimes government lack engineering capacity at all. At other times, there's a skills mismatch. In this case, I had the skills to build an iOS application, but we needed a web tool for ease of use and accessibility by multiple teams. With no staff engineer available at the time, without agentic coding, I would not have been able to build this product.
Directing coding agents let me carry the work from research and design into implementation and local testing. I used the City's software-development standards, agent guidance, and security checks available to me. But in the absence of formal engineering supervision, I was careful to limit the scope and framing of the tool: it was a true prototype, which allowed me to move fast with limited oversight, but in turn this critically constrained what use cases were acceptable and what the app was being used for. I deployed it to demonstrate potential and explore data collection approaches, not ship a truly operational tool.
AI as critical enabler - and analytical engine
AI wasn't just helpful with agentic code. I used Claude via AWS Bedrock as the foundation of the app's backend. Through careful prompt design vetted with Citywide experts in street conditions, the AI assessed images against 12 categories (e.g., litter, bulky items, fecal waste) and suggested severity scores. I discovered in practice that while performance was excellent for large and obvious objects or conditins, smaller or more nuanced objects or conditions (needles, public drug use) could be missed.
I responded by refining prompts to make visible cues and inclusion/exclusion guidance more precise. For certain issues, closer photographs helped. I also let users inspect and critique reports and periodically sampled photos and scores for human review. Finally, in the final assessment of app success, I was careful to communicate the limitations of the LLM analytical engine.
Using baseline data to uncover deep inequities
With the support of data scientists from the MOI team, I analyzed the app's data to look for cases of inequity. We found that the Mission District and Bayview communities had similar challenges in street conditions, but generated very different numbers of tickets: vastly more in the Mission versus the Bayview. With 311 ticket counts driving City resource deployments, this suggests that the Bayview likely receives inadequate attention from service providers.
Prototype to scale
I wrapped up the pilot with a final data analysis and visualization, and shared results with senior leaders from across City departments. A next step would be to shore up the technical approach to handle greater scale, deploy the app in much wider use, and establish pipelines of data into departmental workflows.
The app continues to live on: the analysis backend was rebuilt to a better standard to support the Good Neighbor application, which uses a similar LLM-powered approach to identify specific issues of concern.
The prototype also created capability beyond its original purpose: its analysis backend later became an important component of Good Neighbor.
See the workflow
This video switches between the overall map and category views, showing how sampled observations can be explored by type of condition.
Explore the analysis
Compare staff observations with 311 reporting in the preserved interactive presentation.
Open the presentation →Conversation starters
I'm interested in civic tech, AI-forward opportunities in critical infrastructures (transportation, energy, healthcare); and advocacy collaborations and board service opportunities in transportation.
If you're working to make government more capable, companies more effective at delivering sustainable infrastructure, or cities better places to live, reach out.